
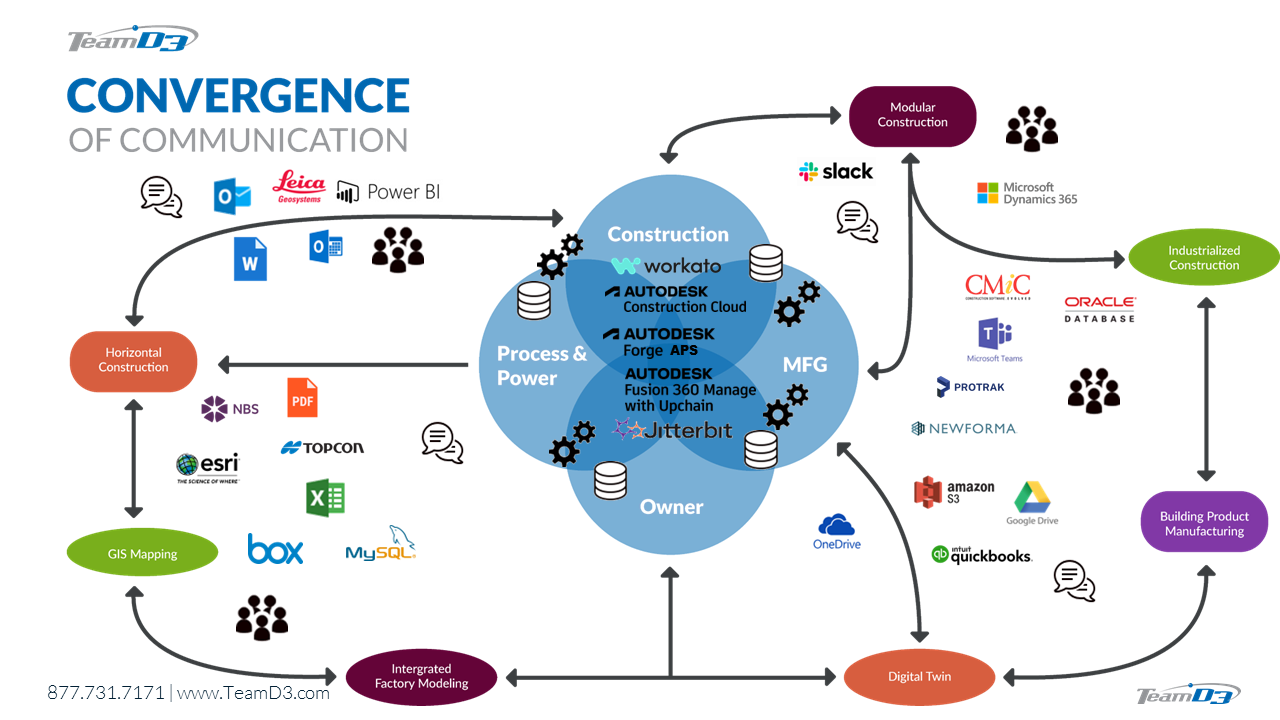
Continuing from our Part 1 conversation, the Venn diagram includes a Communication layer that builds upon the previous design and data convergence. In our earlier conversation, we talked about having multiple connection points to different software solutions and looking at that data through dashboards and reports. Still, we need to expand on this further.
We also need to look at the convergence of communication in this environment. As we work with any one of these industry projects and the many disciplines that come with it, there's a ton of communication going on.
We might use Microsoft Teams and Outlook, Slack, or whatever the tool might be. We need help in tracking communication through these processes and workflows. Designs change, issues arise, RFI's are needed, all these things happen on our projects.
My point is these types of software tools also have connection points in this common data environment. Autodesk has been addressing many of these using Autodesk Construction Cloud to track these problems. Still, again, another software solution might be better when it comes to, let's say, fleet tracking and the communication that goes with that.
As we get better at tracking this data across the platform, our dashboards and reports will continue to improve.
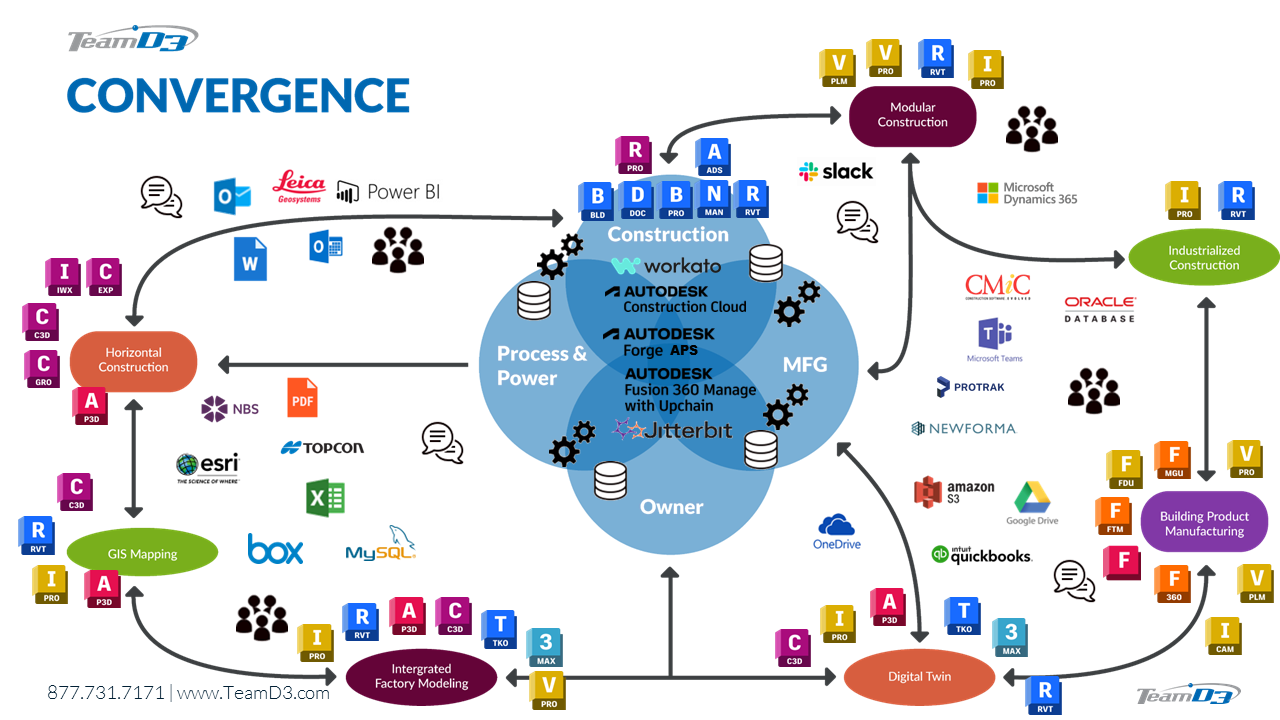
One of the last things is of all the design applications that we use during the day, the week, the month to get our projects done. A mix of desktop solutions and cloud solutions all continuing to feed the common data environment with updated information.
A question to ask yourself, how many applications do you think you might have open at one given time when working in such an environment?
For myself, I typically have Outlook, Teams, Word, Excel, Revit, Inventor, Navisworks, Chrome with at least 10 tabs open, and let's not forget SnagIt and Slack. Multi-tasking is the norm these days, think about how taxing that is on your current workstation.
On top of that, how many of you are working with gigabyte Revit files, or a massive Navisworks collaboration model, or an Inventor or Fusion assembly model made up of hundreds or thousands of parts. Or a huge infrastructure model showing a new layout design of thousands of solar panels, or a map showing all the retail stores across the United States. All this data being pushed and pulled through the common data environment helping us solve the one source of truth.
So, everyone can see and view these data streams in real-time, being able to redline, check, and revise so all stakeholders are informed and able to see progress or bottlenecks. Whatever the need is or whatever the outcome is, everyday this is becoming more interconnected, hence the convergence that we are seeing.
Today's tools are only going to get better and better as machine learning and AI are being added to the mix. To help us facilitate and automate tasks, or to better understand issues, or to alert us before something goes into the ditch.
______________________________________________________
Talking about automation, we all wish we could just post a job and have 50 people post their resume but that's just not reality these days. We have these shortcomings, these gaps, and so the only thing that we can do to help fill in these gaps is to automate a process or task. Some of these tasks or processes are tedious so it would best to automate it so that person can do a more productive or valuable task.
It is amazing to see all this convergence happening in front of us, it's incredible to look back in the last three years and see what has all changed and where we are today. I can't wait to see what the future is going to be in the next three years as this convergence continues even further. -Jarod Schultz

